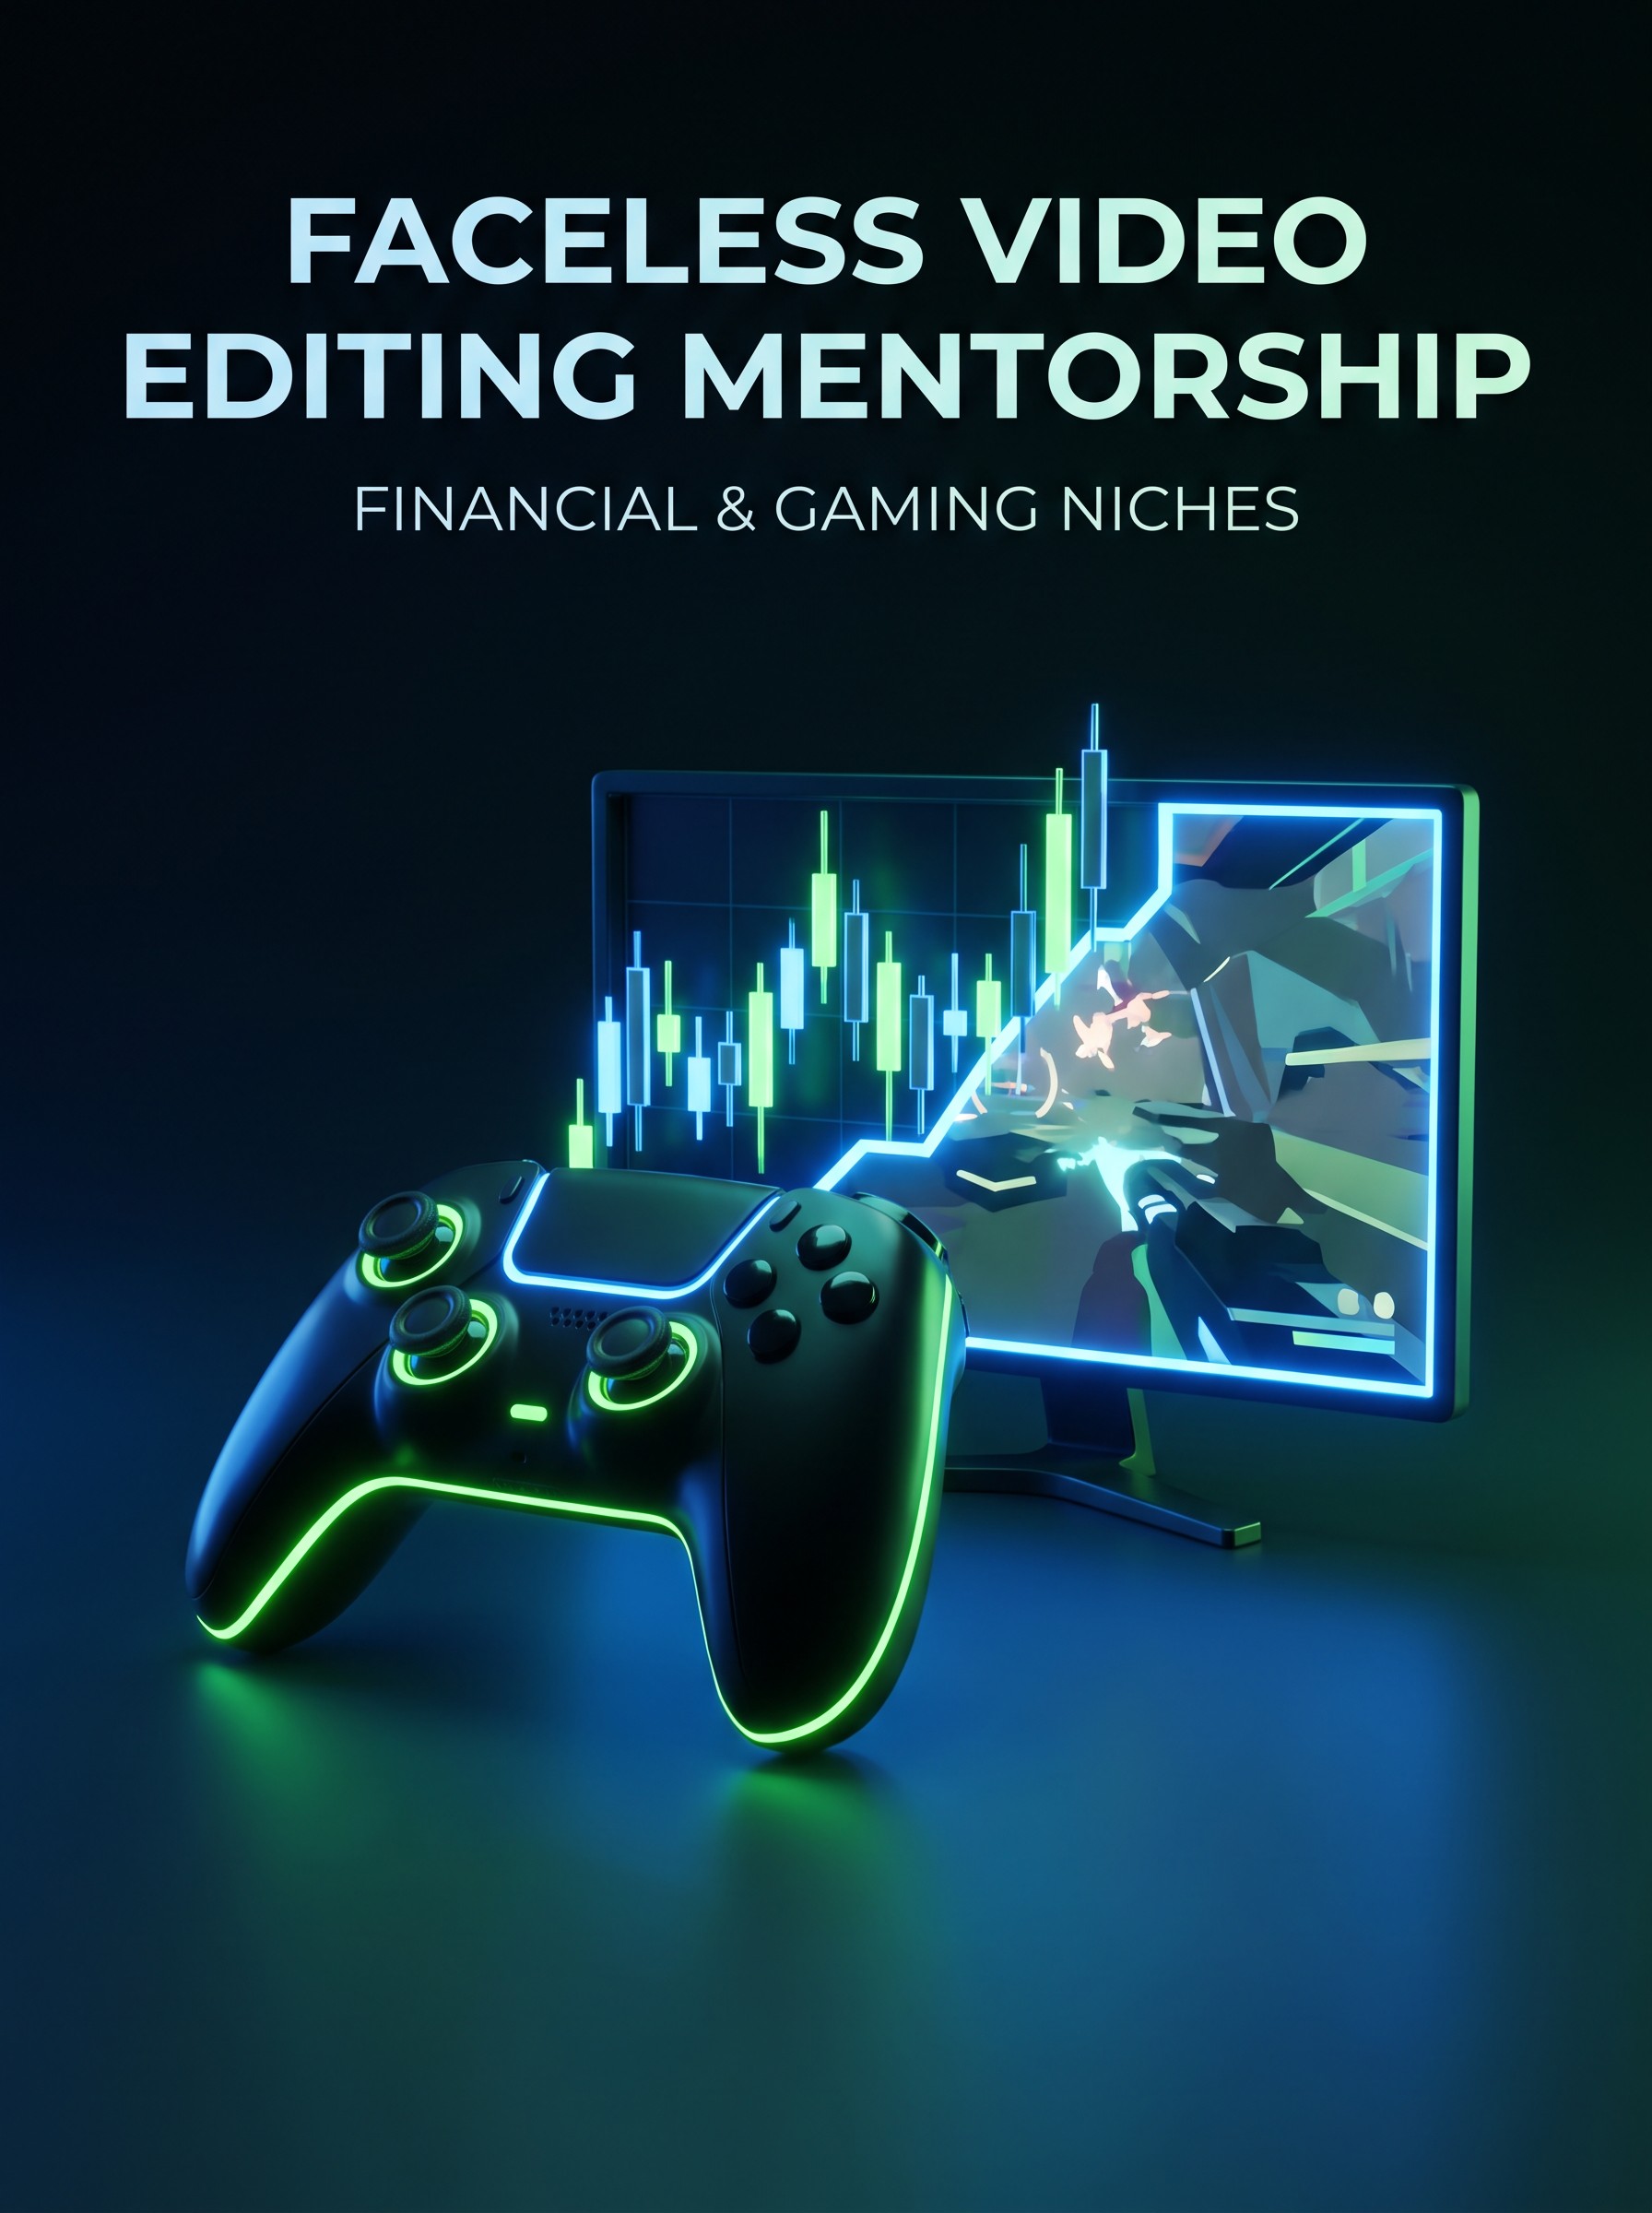

Mixing charts & gameplay :Dynamic Faceless Visuals

Learn to visually merge stock charts, crypto graphs, and high energy gameplay B_roll to keep retention high without ever showing face.
Free
About host
Tonimas
Tonimas
Blogging / Content Writing
5 Skilled
4 Tools
I'm a passionate content creator, blogger, and graphic designer dedicated to creating engaging digital content. I specialize in content creation, eye-catching graphic designs, and managing a faceless YouTube channel that delivers value through creativity and storytelling. My goal is to educate, inspire, and entertain while building a strong online presence and helping brands and audiences connect through quality content.
What to expect
Basic experience with a video editor (CapCut, Premiere Pro, DaVinci Resolve, or equivalent).\n· Access to a PC, Mac, or console to record your own gameplay footage.\n· Willingness to learn basic charting tools (Google Sheets, Excel, or specialized gaming stats sites).\n· A genuine interest in creative visual storytelling and motion graphics.
Details
Are you ready to turn raw gaming data into an immersive, engaging viewer experience—without ever showing your face?

In this session, we bridge the gap between analytics and entertainment. We'll explore how to take static charts, KPIs, and gameplay stats, and transform them into dynamic, eye-catching motion graphics that flow seamlessly over your gaming footage. Whether you're trying to boost your streaming analytics, create viral YouTube shorts, or build an educational gaming channel, mastering this hybrid editing style is the key to standing out in today's faceless creator economy.

We will walk through the exact workflow, tool stack, and creative tricks used to keep audiences glued to the screen while you interpret the data behind the game.