Introduction
Building a creative business requires more than talent, passion, and beautiful work. In today’s digital world, creatives also need strategy, structure, and clear decision-making. Whether you are a designer, photographer, content creator, writer, illustrator, video editor, blogger, or freelancer, your creativity becomes more powerful when it is supported by data.
A data-driven creative business is a business that uses information to make better decisions. Instead of guessing what clients want, which content works, or what service to promote, you use data to understand your audience, track your progress, improve your offers, and grow with confidence.
This does not mean you must become a data scientist. It simply means learning how to collect useful information, organize it, study it, and use the insights to improve your creative work and business growth.
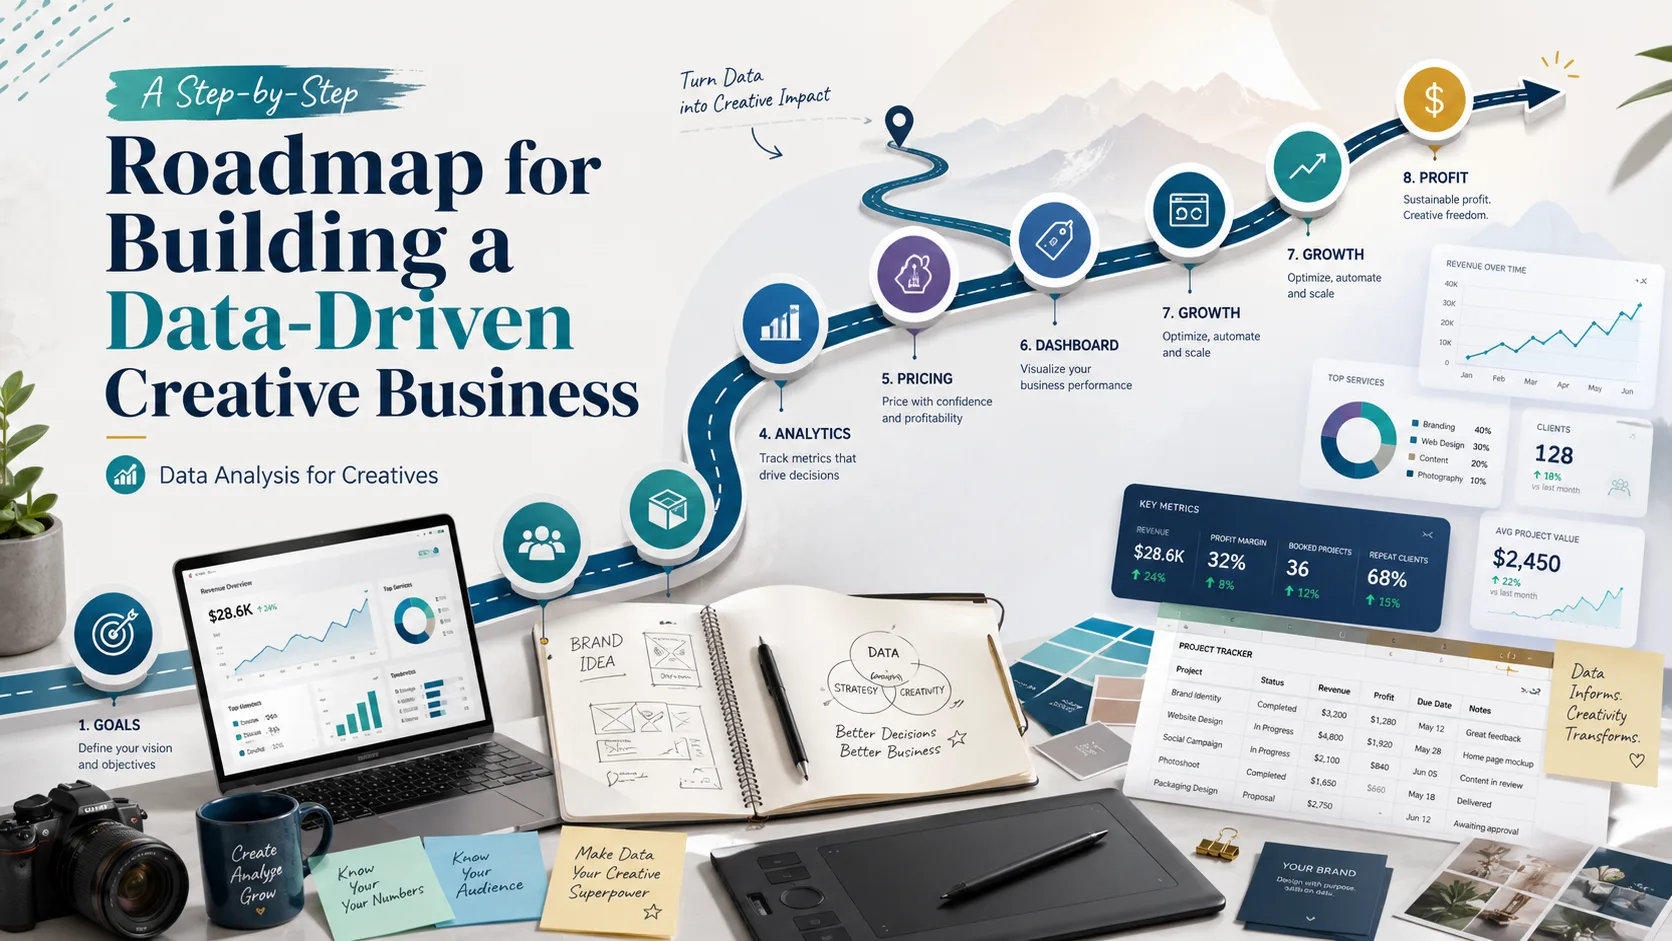
This roadmap will guide you step by step on how to build a creative business that is not only artistic but also strategic, measurable, and sustainable.
What Is a Data-Driven Creative Business?
A data-driven creative business is a creative business that uses data to guide decisions. It combines creativity with analysis. The creative side helps you produce original work, while the data side helps you understand what works, what needs improvement, and where opportunities exist.
For example, a graphic designer can use data to know which service brings the most clients. A photographer can track which packages sell best. A blogger can use website analytics to know which topics attract readers. A content creator can study social media analytics to understand what content gets the most engagement.
A data-driven creative business asks important questions such as:
- What service is bringing the most income?
- Which content attracts my ideal audience?
- Which platform brings the best clients?
- What problems do my customers need help with?
- Which offer should I improve or remove?
- How much am I earning each month?
- What marketing activity gives the best result?
- How can I grow more consistently?
When you answer these questions with data, your business decisions become clearer and stronger.
Why Creatives Need Data for Business Growth
Many creatives start their business with passion but without proper tracking. They may accept projects, post content, and offer services without measuring what is actually working. Over time, this can lead to confusion, burnout, and slow growth.
Data helps solve this problem. Data gives you evidence. It shows which activities are bringing results and which ones are wasting time. It helps you know whether your business is growing, whether your marketing is working, and whether your services are profitable.
For example, you may think Instagram is your best platform because it gives you many likes. But when you track client inquiries, you may discover that LinkedIn brings fewer likes but better-paying clients. Without data, you may continue focusing on the wrong platform.
Data helps creatives:
- Understand their audience better
- Track income and expenses
- Identify profitable services
- Improve marketing strategy
- Measure content performance
- Understand client needs
- Make smarter pricing decisions
- Reduce guesswork
- Build a more professional business
A creative business grows better when decisions are based on insight, not assumption.
Step 1: Define Your Creative Business Goals
The first step is to define what you want your creative business to achieve. Without clear goals, it becomes difficult to know what data to track.
Your business goals may include:
- Getting more clients
- Increasing monthly income
- Growing your audience
- Selling digital products
- Improving client retention
- Building a stronger portfolio
- Increasing website traffic
- Growing your email list
- Improving social media engagement
- Getting more referrals
Your goals should be clear and measurable. Instead of saying, “I want to grow,” say, “I want to get five new client inquiries this month” or “I want to increase my monthly income by 20%.”
Clear goals help you measure progress. For example, if your goal is to get more clients, you should track inquiries, consultation calls, proposals sent, proposals accepted, and client conversion rate. If your goal is to grow your audience, you should track reach, engagement, followers gained, website visits, and email subscribers.
A data-driven business begins with a clear direction.
Step 2: Identify Your Target Audience
Your target audience is the group of people your business is created to serve. If you do not understand them, it will be difficult to create the right services, content, and offers.
As a creative, your audience may include:
- Small business owners
- Personal brands
- Content creators
- Fashion brands
- Startups
- Students
- Bloggers
- Event planners
- Corporate organizations
- Other creatives
To understand your target audience, ask:
- Who needs my service?
- What problem do they have?
- What result do they want?
- What type of content do they engage with?
- Where do they spend time online?
- What questions do they often ask?
- What makes them choose one creative over another?
Data can help you answer these questions. You can collect audience data from social media comments, surveys, client conversations, Google Analytics, social media insights, and frequently asked questions.
When you understand your audience, your business becomes more focused. You stop trying to serve everyone and start speaking clearly to the people who need your work most.
Step 3: Track Your Services and Offers
A creative business usually has different services or offers. For example, a designer may offer logo design, brand identity, social media templates, and presentation design. A photographer may offer portrait shoots, event photography, product photography, and editing services.
To build a data-driven business, you need to track how each service performs.
Important service data to track includes:
- Service name
- Number of inquiries
- Number of clients
- Price charged
- Revenue generated
- Time spent
- Client feedback
- Repeat clients
- Profitability
- Difficulty level
- Demand level
Tracking your services helps you know which offers are worth focusing on. For example, you may discover that logo design brings many inquiries but takes too much time and produces low profit. You may also find that brand identity packages bring fewer clients but higher income. This insight can help you improve your pricing and service structure.
Not every service deserves the same attention. Data helps you know what to keep, improve, promote, or remove.
Step 4: Track Your Clients and Leads
Leads are people who show interest in your services. They may message you, fill a form, ask for your price, or request a consultation. Tracking leads helps you understand how people move from interest to payment.
You can create a simple client tracker using Excel or Google Sheets.
Useful columns include:
- Date
- Client name
- Contact source
- Service requested
- Budget
- Status
- Follow-up date
- Proposal sent
- Proposal accepted
- Amount paid
- Project completed
- Feedback
- Referral possibility
Contact source is very important. It tells you where the client came from. For example, they may come from Instagram, LinkedIn, WhatsApp, your blog, referral, or website.
After tracking for some time, you may discover that referrals bring the most serious clients, while Instagram brings more casual inquiries. Or you may discover that LinkedIn leads have higher budgets than other platforms.
This information helps you focus your marketing efforts where they matter most.
Step 5: Track Your Income and Expenses
A creative business must be financially healthy. Many creatives focus on creating work but do not track their money properly. This can make it difficult to know whether the business is actually profitable.
Track income from:
- Client projects
- Digital products
- Consultations
- Workshops
- Affiliate income
- Blog income
- Retainers
- Template sales
- Brand collaborations
Also track expenses such as:
- Internet subscription
- Software subscriptions
- Design tools
- Equipment
- Transport
- Marketing costs
- Website hosting
- Training or courses
- Outsourcing
- Data bundles
When you track income and expenses, you can calculate profit.
Profit = Total Income − Total Expenses
For example, if you earn ₦300,000 in a month and spend ₦80,000 on business expenses, your profit is ₦220,000.
Tracking money helps you make better pricing decisions, reduce unnecessary spending, and understand your business growth.
Step 6: Measure Your Content Performance
Content is one of the most powerful tools for growing a creative business. It helps you attract attention, educate your audience, show your expertise, and build trust.
However, content should not be created blindly. You should track how your content performs.
Important content metrics include:
- Reach
- Views
- Likes
- Comments
- Shares
- Saves
- Clicks
- Profile visits
- Website visits
- Followers gained
- Client inquiries
- Engagement rate
Engagement rate can be calculated as:
Engagement Rate = Total Engagement ÷ Reach × 100
Tracking content helps you know what attracts your audience and what leads to business results.
For example, a post showing your design process may get many saves and shares. A post explaining your service may bring inquiries. A blog post about solving a client problem may bring website traffic. Each type of content has a role.
A data-driven creative business uses content not just for posting, but for growth.
Step 7: Use Website and Blog Analytics
If you have a website, portfolio, or blog, you should track website performance. Google Analytics can help you understand how visitors interact with your site.
Important website metrics include:
- Users
- Page views
- Traffic sources
- Top pages
- Engagement rate
- Average engagement time
- Contact page visits
- Portfolio page visits
- Form submissions
- Device type
This data helps you understand whether your website is supporting your business. For example, if many people visit your portfolio but few contact you, your call-to-action may be weak. If blog posts bring traffic but not inquiries, you may need to link your services inside your articles. If most visitors come from LinkedIn, you may need to promote more content there.
Your website should not just look good. It should help your business grow.
Step 8: Improve Your Offers With Data
Your offers are the services, products, or packages you sell. Data can help you improve them.
For example, if many people ask for “social media design packages,” that may show demand. If clients often complain that your packages are unclear, you may need to simplify your offer. If people ask for payment plans, you may create flexible pricing options.
You can improve your offers by tracking:
- Frequently asked questions
- Common client problems
- Most requested services
- Services with highest profit
- Services with best feedback
- Services that take too much time
- Offers that convert best
Data helps you create offers people actually want.
For example, instead of offering only “graphic design,” you can create a clearer package such as:
Brand Identity Starter Package for Small Businesses
This kind of offer is specific, easier to understand, and more attractive to the right audience.
Step 9: Make Better Pricing Decisions
Pricing is one of the hardest parts of running a creative business. Many creatives undercharge because they do not track their time, expenses, and value.
Data can help you price better. Track:
- Time spent on each project
- Expenses involved
- Number of revisions
- Client budget
- Profit per project
- Demand for the service
- Skill level required
- Value delivered to the client
For example, if a project takes 20 hours and you charge very little, you may discover that the service is not profitable. If a certain package gets high demand and strong feedback, you may increase the price gradually.
Pricing should not be based only on emotion. It should be based on time, skill, value, cost, and market demand.
Step 10: Build a Simple Business Dashboard
A business dashboard helps you see your creative business performance in one place. You can create it using Excel or Google Sheets.
Your dashboard can include:
- Monthly income
- Monthly expenses
- Profit
- Number of leads
- Number of clients
- Conversion rate
- Best-performing service
- Best traffic source
- Top content
- Website visits
- Client inquiries
- Follower growth
A dashboard helps you review your business quickly.
For example, at the end of each month, you can look at your dashboard and know:
- How much you earned
- How much you spent
- Where clients came from
- Which service performed best
- Which content brought attention
- What needs improvement next month
A dashboard makes your business more organized and professional.
Step 11: Turn Insights Into Action
Data is not useful if you do not act on it. The goal is not just to collect numbers but to improve your business.
For example:
- If one service brings the highest profit, promote it more.
- If LinkedIn brings better clients, post more professional content there.
- If your website gets traffic but no inquiries, improve your call-to-action.
- If clients keep asking the same question, create content answering it.
- If one package takes too much time, increase the price or simplify it.
- If a blog post gets many views, add service links inside it.
Every insight should lead to a decision. This is what makes a business data-driven.
Step 12: Review Your Business Monthly
A monthly review helps you stay focused and consistent. At the end of every month, review your data and ask:
- How much did I earn?
- How much did I spend?
- What was my profit?
- How many leads did I get?
- How many clients did I convert?
- Which service performed best?
- Which platform brought the best clients?
- Which content performed best?
- What should I improve next month?
Write down three key insights and three actions for the next month.
For example:
-
Insight 1: LinkedIn brought the most serious inquiries.
Action: Post three professional case studies on LinkedIn next month. -
Insight 2: Brand identity package brought the highest profit.
Action: Promote the package more clearly on my profile and website. -
Insight 3: Blog posts about Excel received more traffic.
Action: Create more Excel-based content for creatives.
Monthly reviews help you grow intentionally.
Common Mistakes Creatives Should Avoid
1. Not Tracking Anything
If you do not track your business, you will not know what is working. Start with simple tracking.
2. Tracking Too Many Metrics
Do not overwhelm yourself. Track the numbers that connect to your goals.
3. Focusing Only on Followers
Followers are useful, but they do not always mean income. Track inquiries, clients, sales, and profit.
4. Ignoring Expenses
Revenue is not the same as profit. Always track expenses.
5. Making Decisions Based on Emotion Alone
Your feelings matter, but business decisions should also be supported by data.
6. Not Reviewing Results
Collecting data without reviewing it is not useful. Set time for weekly or monthly review.
7. Not Taking Action
Data should lead to improvement. If you find an insight, use it.
A Simple 30-Day Roadmap for Building a Data-Driven Creative Business
Week 1: Set Up Your Foundation
Define your business goal, target audience, and main services. Create a simple tracker for services, clients, income, and content performance.
Week 2: Start Collecting Data
Record your client inquiries, content results, income, expenses, and website or social media performance. Keep the data simple and consistent.
Week 3: Analyze Your Results
Look for patterns. Identify your best-performing content, most profitable service, best client source, and biggest business challenge.
Week 4: Improve and Take Action
Use your insights to improve your offers, pricing, content strategy, and client process. Create a simple monthly dashboard and plan your next actions.
By the end of 30 days, you will have a clearer view of your creative business and what you need to improve.
Conclusion
Building a data-driven creative business does not mean losing creativity. It means using information to make your creativity more effective and profitable. Data helps you understand your audience, track your services, measure income, improve offers, and make better business decisions.
For creatives, this is a powerful advantage. Many people create, but not everyone measures. When you learn to measure and improve, your business becomes more professional, strategic, and sustainable.
Start small. Track your clients, content, income, expenses, and services. Review your results every month. Use your insights to improve your offers and focus on what works.
Creativity gives your business identity, but data gives it direction. When both work together, you can build a creative business that grows with clarity, confidence, and purpose.